

How to Handle Backtesting Bias Caused by Missing Historical K-Line Data in Quantitative Strategy Development
Missing historical K-lines can distort backtest results without causing errors. Learn how to detect data gaps, distinguish missing data from normal market breaks, validate OHLC data, and build more reliable backtests.
In quantitative strategy development, an abnormal backtest result does not necessarily mean that there is a problem with the strategy logic. A more hidden cause is missing historical K-line data.
For example, suppose a strategy uses a 20-day moving average to determine an entry signal. If several K-lines are missing in the middle of the historical dataset, the program may not throw an error and may continue calculating as usual. The problem is that the “20 K-lines” seen by the strategy may actually cover a longer real-world time period. As a result, moving averages, volatility, momentum, and other indicators may change.
More importantly, this type of problem may not cause the backtesting program to fail. Instead, it can silently change trading signals and eventually create backtesting bias.
Why Can Missing a Few K-Lines Change Backtest Results?
Historical K-lines are not simply a list of prices. For most quantitative strategies, every K-line participates in indicator calculations and trading-condition evaluation.
Suppose a strategy uses:
MA20 = Average closing price of the most recent 20 K-linesIf three K-lines are missing in the middle of the dataset, the program may still return 20 data points and calculate an apparently normal MA20. However, those 20 data points now cover a different real-world time range.
The same issue can affect:
- RSI, MACD, KDJ, and other indicators that depend on historical windows
- Risk indicators such as ATR and historical volatility
- Price conditions such as breakouts of previous highs or moving averages
- Trend detection that depends on consecutive K-lines
- Holding periods and the timing of trading signals
Therefore, what needs to be checked in backtesting is not simply whether the API returned data. The important questions are whether the data is complete, whether the timestamps are continuous, and whether the missing data occurred during an actual trading session.
First Determine Whether the Data Is Really Missing or Simply Not Trading
This is an issue that is easily confused in quantitative strategy development.
When using 1-minute K-lines, the absence of data overnight does not necessarily mean that historical K-line data is missing. Weekends, holidays, exchange lunch breaks, and periods when a market is not trading should not simply be treated as data anomalies.
The real question is:
Did an unreasonable time gap occur during a period when trading data should normally exist?
For example, suppose the data during a normal trading session looks like this:
10:31
10:32
10:33
10:35
If the strategy uses 1-minute K-lines, 10:34 should be investigated further.
However, if the data is:
11:59
13:00
and the corresponding market has a lunch break from 12:00 to 13:00, this is not missing historical K-line data.
Therefore, backtest data validation should not simply use:
df["timestamp"].diff() > 1 minuteto determine whether a gap is abnormal. The specific market’s trading calendar and trading sessions should first be considered before deciding whether a time gap is actually abnormal.
Four Types of Data Problems to Check Before Backtesting
A practical approach is to add a data-quality validation layer before running the strategy instead of leaving data anomalies for the strategy itself to handle.
The first category is timestamp issues.
Check whether the data is sorted in ascending time order, whether duplicate timestamps exist, and whether there are unreasonable time jumps within the same trading session.
The second category is OHLC completeness.
For example, a K-line may contain an open and close price but have a missing high or low. If the strategy uses ATR, volatility, or breakout conditions, this type of anomaly may directly affect trading signals.
The third category is data continuity.
For time periods where K-lines are expected to exist, check whether there are any gaps.
The fourth category is insufficient historical coverage.
For example, suppose a strategy requires a 250-day moving average, but the dataset contains only 180 valid trading days. The program may still run by simply using the available data, but the dataset no longer satisfies the original requirements of the strategy.
The following simple function can be used as an entry point for data-quality validation before backtesting:
import pandas as pd


def validate_kline_data(df: pd.DataFrame):
    required = ["timestamp", "open", "high", "low", "close"]

    missing_columns = [
        col for col in required
        if col not in df.columns
    ]

    if missing_columns:
        raise ValueError(
            f"Missing required columns: {missing_columns}"
        )

    df = df.copy()
    df["timestamp"] = pd.to_datetime(df["timestamp"])
    df = df.sort_values("timestamp")

    # Duplicate timestamps
    duplicated = df["timestamp"].duplicated().sum()
    if duplicated:
        raise ValueError(
            f"Found {duplicated} duplicated timestamps"
        )

    # Basic OHLC relationship check
    invalid_ohlc = (
        (df["high"] < df["open"]) |
        (df["high"] < df["close"]) |
        (df["low"] > df["open"]) |
        (df["low"] > df["close"])
    )

    if invalid_ohlc.any():
        raise ValueError("Invalid OHLC relationship detected")

    # Check intervals between adjacent timestamps
    gaps = df["timestamp"].diff()

    return {
        "rows": len(df),
        "start": df["timestamp"].min(),
        "end": df["timestamp"].max(),
        "max_gap": gaps.max(),
        "gap_count": int((gaps > gaps.median() * 2).sum())
    }
This code cannot replace a trading calendar, but it can first identify duplicate timestamps, abnormal OHLC relationships, and obvious time-interval anomalies.
For production backtesting, a more robust approach is to build an expected trading-time series based on the specific market and then compare it with the actual K-line timestamps. This is especially important for markets such as Hong Kong and A-shares, where lunch breaks exist.
Do Not Solve Missing Data Gaps by Simply Deleting Missing Rows
This is a common problem in backtesting scripts.
Suppose the original data contains:
09:30
09:31
09:32
09:34
09:35
If the abnormal record is simply deleted, the remaining data can still be used to calculate MA, RSI, and other indicators.
But the problem has not disappeared.
If the strategy treats every row as a consecutive 1-minute K-line, the 09:34 record will effectively be treated as the next K-line after 09:33, even though 09:33 is missing.
A better approach is to classify the missing data according to its cause.
If it is a normal market break: Keep the time gap and do not artificially create prices.
If it is a data-source gap: Mark the affected interval and decide whether the affected backtest period should be excluded.
If data retrieval failed: Retrieve the original K-line data again instead of generating K-lines through interpolation.
If the missing data causes an insufficient indicator window: Do not generate trading signals until the minimum historical window required by the strategy is available.
For OHLC data, blindly using the previous value to fill missing K-lines is also not recommended. Copying the previous close into the new open, high, low, and close values may make the price series appear continuous, but it can change volatility, volume, and breakout conditions.
The Historical K-Line API Can Also Become Part of Data Integrity Management
When historical data comes from an API, it is not enough to check whether the API can return K-lines. You also need to consider how much data can be retrieved in a single request and how the historical data should be stored over time.
AllTick’s REST API provides a single-symbol K-line query interface, with up to 500 K-lines returned in a single request. Stock K-lines support intervals including 1 minute, 5 minutes, 15 minutes, 30 minutes, hourly, daily, weekly, and monthly, while 2-hour and 4-hour intervals are not supported for stocks. AllTick
This means that if a backtest requires several years of historical data, the data returned by a single request should not be treated as a complete historical dataset.
A more reliable process is:
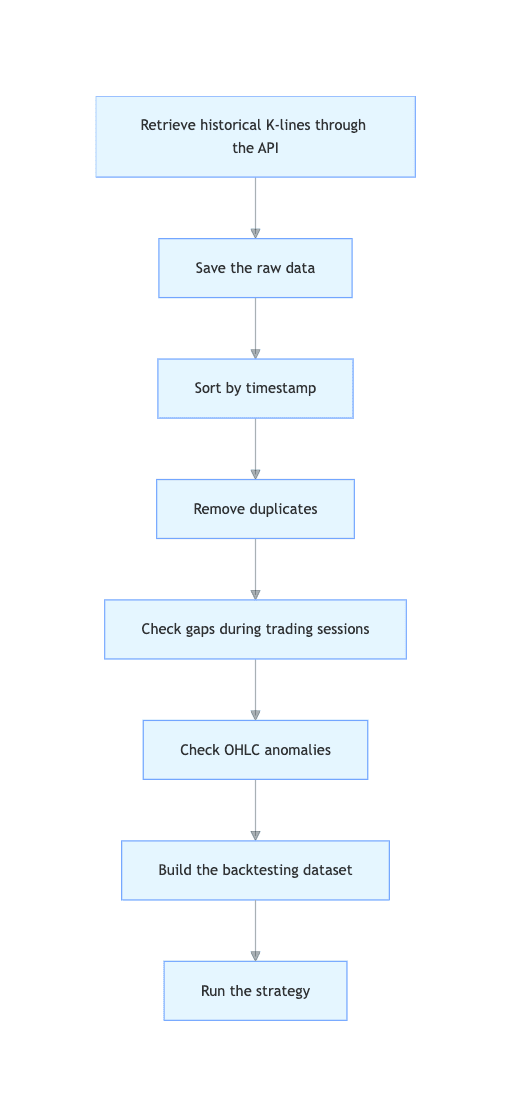
AllTick’s official development materials also recommend combining historical K-line retrieval with local data storage to build your own historical dataset instead of requesting the same historical data again every time a backtest is performed.
For simple strategy testing, you can first retrieve a limited amount of historical data to validate the strategy logic. Once you move into formal backtesting, however, the validated data should be persisted. This makes it easier to determine whether a change in the backtest result comes from a change in the strategy code or a change in the input data.
Another Easily Overlooked Problem: Insufficient Historical Coverage
Suppose a strategy requires:
250-day moving average
+ 60-day volatility
+ 20-day momentum
In this case, the required data should not start only from the first day of the backtest period.
If the backtest starts on January 1, 2025, enough historical data should be prepared in advance so that all required indicators can be fully calculated on the first backtest day.
Otherwise, data from the first few months may be skipped because the indicator initialization window is insufficient. Different implementations may also use different initialization methods, eventually producing inconsistent backtest results.
AllTick currently provides different historical K-line coverage depending on the plan. The official pricing page lists historical coverage periods such as 1 year, 3 years, and 5 years. Therefore, when choosing a data plan, you should first confirm that the historical coverage is sufficient for the strategy’s backtesting period.
This is why quantitative strategy development should consider historical data coverage and K-line completeness together. A dataset can have sufficient historical coverage but still contain gaps, or it can be complete but not cover a long enough historical period. Either situation can distort backtest results.
Put Data-Quality Checks Before Strategy Execution
A reliable quantitative backtesting workflow should not simply be:

Instead, a data-validation stage should be added:
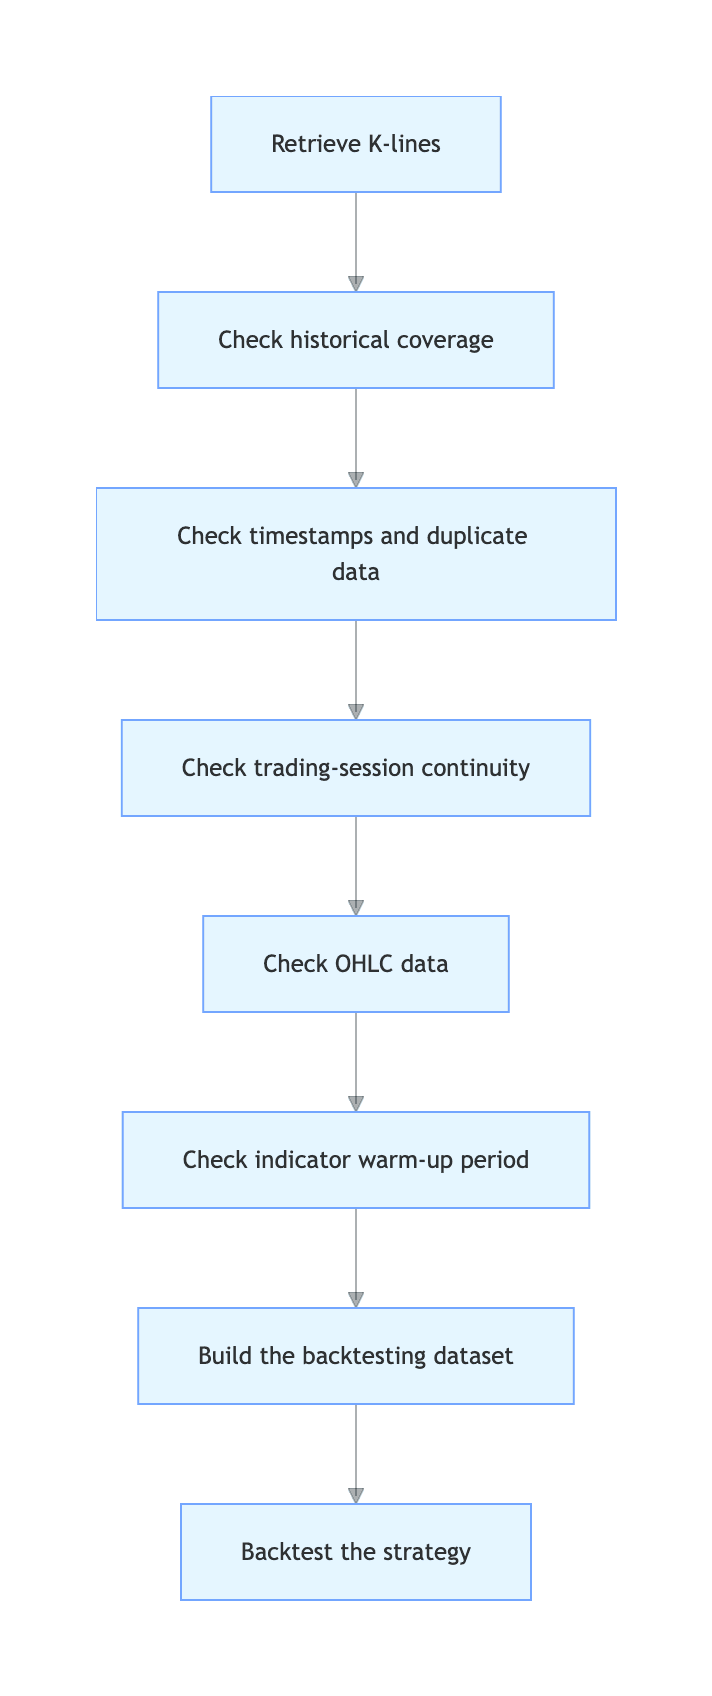
The value of this approach is not to make the backtesting code unnecessarily complicated. It is to separate data problems from strategy problems.
When the return of a backtest suddenly changes from 20% to 8%, the developer should first be able to answer whether the strategy logic changed or whether the input data changed.
For scenarios that require historical K-lines from multiple markets for quantitative strategy development, AllTick can be used as one of the historical market-data API sources. Its REST API supports historical K-line queries, allowing developers to retrieve the symbols and intervals required by their strategies and then perform deduplication, completeness checks, and backtesting data management in their own data layer.
If you are building a long-term data pipeline for a backtesting system, it is better to design the system around checking whether the data is complete before investigating historical K-lines only after the strategy’s returns become abnormal.
For current API parameters, authentication methods, and specific data coverage, see the AllTick Official API Documentation.