

How to Use KDJ Stochastics to Determine Entry Points for Gold (XAUUSD)?
Learn how quantitative traders use KDJ crossovers, overbought and oversold levels, and divergence to identify potential XAUUSD entry points. Explore Python calculations and AllTick market data for systematic strategy testing.
For quantitative traders, a useful XAUUSD entry signal needs more than an indicator crossover. It needs a repeatable rule that can be tested against historical prices and monitored as new market data arrives. The KDJ Stochastic Indicator helps identify changes in short-term momentum, but its signals can become unreliable when gold trends strongly or prices fluctuate around key levels.
This guide explains how to calculate KDJ, interpret crossover and divergence signals, and turn them into testable XAUUSD trading conditions. It also covers how to use market data from AllTick to support indicator calculations and strategy validation.
Understanding the KDJ Indicator for Gold Trading
KDJ extends the traditional Stochastic Oscillator by adding a third line, J, to highlight changes in momentum.
- K line: Responds relatively quickly to changes in price momentum.
- D line: Smooths the K line and helps identify shifts in momentum.
- J line: Calculated from K and D, it amplifies their difference and can move above 100 or below 0.
A common configuration uses a nine-period lookback with three-period smoothing for K and D, often described as KDJ (9, 3, 3). The exact calculation and initialization can differ across charting platforms, so quantitative traders should standardize the implementation before comparing results.
The indicator uses recent highs, lows, and closing prices. For gold, the selected timeframe matters: a five-minute KDJ can generate frequent signals, while a one-hour KDJ may filter out some short-term fluctuations at the cost of later entries.
How to Identify Potential XAUUSD Entry Signals
1.Look for K and D Crossovers
A bullish crossover occurs when K moves above D after being below it. This can indicate improving short-term momentum and may provide a potential long setup.
A bearish crossover occurs when K moves below D. It can indicate weakening momentum and may provide a potential short setup.
Neither crossover guarantees a reversal. During a strong gold trend, K and D can cross repeatedly without a meaningful change in the broader direction.
For a more disciplined entry rule, require additional confirmation:
- For a potential long entry, look for a bullish crossover after K has recently entered the oversold region.
- For a potential short entry, look for a bearish crossover after K has recently entered the overbought region.
- Check whether price action supports the signal, such as a recovery above a tested support level or a rejection near resistance.
These conditions turn a visual observation into a strategy that can be evaluated consistently.
2. Use Overbought and Oversold Levels as Context
The commonly used KDJ reference levels are 80 and 20.
When K moves below 20, gold may be experiencing strong selling pressure. A subsequent bullish crossover can suggest that downward momentum is easing. When K rises above 80, buying pressure may be extended; a subsequent bearish crossover can indicate weakening momentum.
However, overbought does not automatically mean sell, and oversold does not automatically mean buy. Gold can remain overbought during a sustained rally or oversold during a sharp decline.
Use these levels to identify conditions worth investigating rather than as independent entry instructions. The J line can exceed the conventional 0–100 range, so its extreme values should not be interpreted in exactly the same way as K and D.
3. Check for KDJ Divergence
Divergence can help identify situations in which price movement and momentum are no longer developing in the same direction.
Bullish divergence: XAUUSD forms a lower price low, while the indicator forms a higher low. This may suggest that selling momentum is weakening.
Bearish divergence: XAUUSD forms a higher price high, while the indicator forms a lower high. This may suggest that buying momentum is weakening.
Divergence is an early warning, not a confirmed entry. Quantitative systems should define how swing highs and lows are identified and whether the signal requires a subsequent crossover or price confirmation. Without these rules, divergence detection can become subjective or introduce look-ahead bias into backtests.
Calculate KDJ and Generate Repeatable Signals
The most reliable way to evaluate KDJ is to calculate it consistently from OHLC candlestick data rather than rely on visual chart interpretation alone.
For a lookback period \(n\), the Raw Stochastic Value (RSV) is:
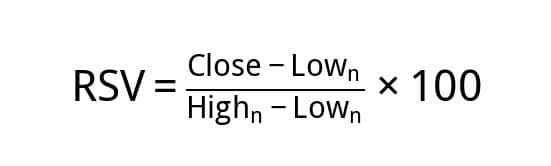
Here, \(High_n\) and \(Low_n\) are the highest high and lowest low over the selected lookback window.
With three-period smoothing, the recursive calculations are:
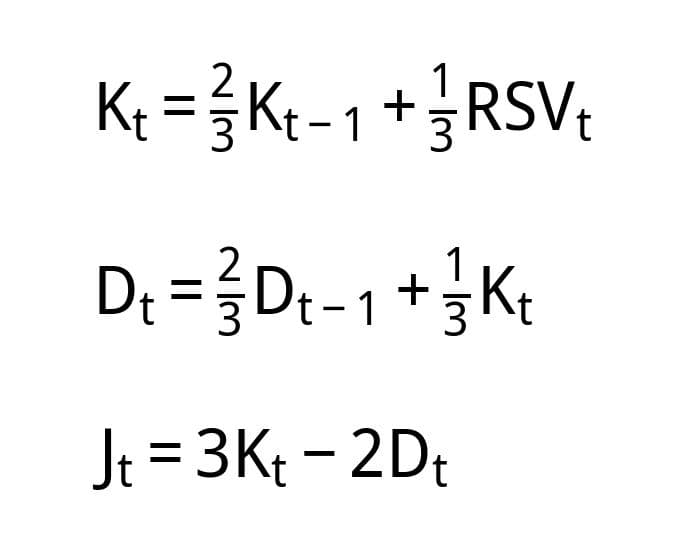
The following Python example calculates KDJ using a DataFrame containing XAUUSD candles. The rows must be sorted from oldest to newest.
import pandas as pd

# df contains chronological OHLC candles:
# high, low, close

period = 9

lowest = df["low"].rolling(period).min()
highest = df["high"].rolling(period).max()
price_range = highest - lowest

# A zero-range window produces an undefined RSV.
rsv = (
    (df["close"] - lowest)
    / price_range
    * 100
).where(price_range.ne(0))

# Recursive smoothing with alpha = 1/3.
df["K"] = rsv.ewm(
    alpha=1/3, adjust=False
).mean()

df["D"] = df["K"].ewm(
    alpha=1/3, adjust=False
).mean()

df["J"] = 3 * df["K"] - 2 * df["D"]

# Identify crossover candidates.
cross_up = (
    (df["K"] > df["D"])
    & (df["K"].shift(1) <= df["D"].shift(1))
)

cross_down = (
    (df["K"] < df["D"])
    & (df["K"].shift(1) >= df["D"].shift(1))
)

# Require an overbought/oversold context.
recent_oversold = df["K"].rolling(3).min() < 20
recent_overbought = df["K"].rolling(3).max() > 80

df["long_setup"] = cross_up & recent_oversold
df["short_setup"] = cross_down & recent_overbought
These conditions identify candidate setups, not automatic trade instructions. The code uses the first available RSV to initialize exponential smoothing, so values near the beginning of a series may differ from platforms that use another initialization method. Warm-up bars should be excluded from strategy evaluation, and undefined values should be handled consistently.
Before using these signals in a trading system, also check the candle timestamps, timeframe, and whether each bar is complete. A crossover on an unfinished candle can disappear before the bar closes.
Using AllTick Data for KDJ Strategy Testing
Indicator calculations are only as dependable as the price data behind them. For quantitative traders, inconsistent timestamps, missing candles, or mismatched price series can produce signals that cannot be reproduced in live trading.
AllTick's Commodities API lists XAUUSD gold data, including OHLC candles and historical time series. Its data interfaces support REST requests and WebSocket streaming.
A practical workflow is to retrieve historical candles for initial calculations and backtesting, then use the appropriate live data stream to monitor market changes. If working directly from ticks, aggregate them into candles using the same timeframe and boundaries as the backtest.
Before evaluating a KDJ strategy, verify that:
- Historical and live data use consistent instrument identifiers and price conventions.
- Candle boundaries and timestamps follow the intended trading-session rules.
- Signals are generated only from information available at the time of the decision.
- Entry prices, spread, slippage, transaction costs, and stop-loss rules are included in backtesting.
- Results are tested across different gold market conditions rather than a single favorable period.
The AllTick API documentation provides a starting point for checking available endpoints and integration requirements.
Common Mistakes When Using KDJ for Gold Entries
Treating every crossover as a trade. Crossovers can occur frequently in sideways markets. Requiring momentum context and price confirmation can make a strategy more selective.
Ignoring the prevailing trend. An oversold reading during a strong downtrend does not necessarily signal an imminent recovery. Consider a higher timeframe or a clearly defined trend filter.
Overfitting indicator settings. A parameter combination that performs well on one historical sample may fail on unseen data. Compare a reasonable range of settings and validate the final rules out of sample.
Ignoring execution conditions. A theoretically profitable entry may not remain profitable after realistic spreads, slippage, and latency are considered.
A strong KDJ strategy is therefore not simply a combination of crossover and overbought/oversold rules. It is a defined process for generating signals, controlling risk, and verifying performance against historical and live market data.
Turning KDJ Signals Into a Testable Trading Process
For quantitative traders, KDJ is most useful when treated as one component of a systematic XAUUSD strategy. Crossovers identify changes in momentum, overbought and oversold levels provide context, and divergence can help flag a potential weakening trend.
Combining these signals with consistent OHLC data, explicit entry and exit rules, realistic execution costs, and out-of-sample testing makes the strategy easier to evaluate and reproduce. AllTick can support the data side of that workflow, while the trading rules and their performance still need to be independently tested.