

What Is Volume Profile in Trading?
Volume profile is a commonly used concept in the field of financial investment. It refers to the relative proportion of a particular asset held by investors at a specific point in time. In the stock market…
Volume profile is a commonly used concept in the field of financial investment. It refers to the relative proportion of a particular asset held by investors at a specific point in time. In the stock market, volume profile is typically used to describe how stockholders are distributed across various stock price levels. Roughly speaking, volume profile describes “who” bought or sold “how many” shares at “what price.” Understanding volume profile is crucial for making investment decisions. First, volume profile can help investors understand who the market’s primary participants are, the prices at which they bought, and how much they hold. This information can help investors identify market trends and find potential buying or selling opportunities. For example, if most positions are concentrated in a lower price range, the stock price may be more likely to rise. Second, volume profile can also reflect market participants’ sentiment and expectations. For example, if positions are concentrated at high price levels, it may indicate that investors are optimistic about the stock’s prospects; conversely, if positions are concentrated at low price levels, it may indicate that investors are pessimistic about the stock’s prospects. Overall, by understanding and analyzing volume profile, investors can better understand market dynamics, identify investment opportunities more accurately, and make more informed investment decisions.
1. Definition of Volume Profile
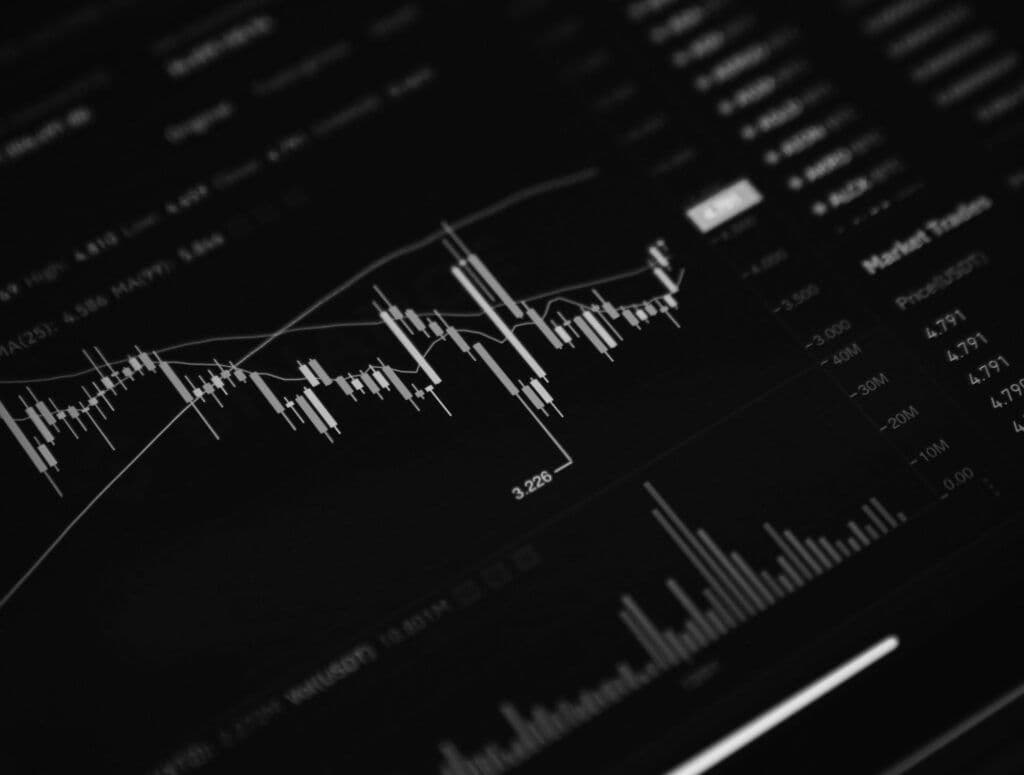
The concept of volume profile originated in the securities market. In the investment field, “positions” generally refer to the securities held by investors, while “volume profile” refers to how these positions are distributed throughout the market. More specifically, volume profile describes how stocks in different price ranges are held by different investors at a given point in time. It reflects the holding costs and quantities of different investors in the market for a particular security, as well as investors’ expectations and confidence regarding the security’s future performance. A volume profile chart is a visual representation of volume profile. It uses stock price as the horizontal axis and the number of shares held as the vertical axis. Through the shape and trend of the chart, it displays the number of shares held by investors in different cost ranges, thereby revealing the structure of market participants and the distribution of holding costs. Understanding the meaning of volume profile is crucial for investors. It can help investors understand how the market’s major forces are distributed and thereby predict future market trends. For example, if most positions are concentrated in a higher price range, this may indicate that the market is optimistic about the security’s future performance; conversely, if most positions are concentrated in a lower price range, this may indicate that the market is pessimistic about the security’s future performance. By analyzing volume profile, investors can better grasp market dynamics and develop more effective investment strategies.
Sources and Composition of Volume Profile
The sources and composition of volume profile are determined by buying and selling activities in the securities market. They reflect investors’ holdings of a particular security during a specific period. Let’s take a look at the sources and composition of volume profile:
Trading Activities: Investors’ buying and selling activities in the securities market are the direct source of volume profile. Every purchase and sale changes the position distribution. For example, when an investor buys a stock within a lower price range, they become part of the positions in that price range. Conversely, if they sell the stock within a higher price range, the positions in that price range correspondingly decrease.
Holding Cost:The cost at which investors purchase securities is also an important component of volume profile. This is usually reflected on the vertical axis of a volume profile chart, representing the quantity of securities held by investors within a particular price range. Differences in holding costs reflect investors’ expectations and confidence regarding future market trends.
Investor Type:Different types of investors, such as retail investors, institutional investors, and insiders, have different investment behaviors and holding costs, which also affect the volume distribution across price levels. For example, institutional investors typically have greater capital and a longer investment horizon. Their purchases and holdings may form a relatively large concentration area on the volume profile chart.
By understanding the sources and composition of volume profile, investors can better interpret volume profile charts, gain insight into market dynamics, and make more informed investment decisions. In the following section, we will explore in depth how to use volume profile to make investment decisions.
2. Volume Profile and Investment Decisions
There is a close relationship between volume profile and stock prices. Understanding this relationship can help us better assess a stock's future trend and develop investment strategies accordingly. The following is a detailed description of the relationship between volume profile and stock prices:
Concentration Areas and Price Support or Resistance: High-concentration areas on a volume profile chart are typically price ranges where investors have concentrated their purchases or holdings. These ranges often become support or resistance levels for the stock price. When the stock price falls near a support level, the large number of holders in that area may choose to increase their holdings or refrain from selling, thereby preventing the stock price from declining further. Similarly, when the stock price rises near a resistance level, investors in that area may choose to sell for a profit, which may also prevent the stock price from rising further.
Changes in volume profile and price trends: Changes in volume profile can also reflect the trend in a stock's price. For example, if new positions are concentrated in a higher price range, it indicates that investors are willing to buy the stock at a higher price, which may signal an upward trend in the stock price. Conversely, if new positions are concentrated in a lower price range, it indicates that investors are only willing to buy after the price falls to a certain level, which may signal a downward trend in the stock price.
The stability of volume profile and price volatility: The stability of volume profile can also affect stock price volatility. If volume profile is relatively concentrated, it indicates that investors' purchase prices do not differ significantly, and they may respond in similar ways, which may result in lower stock price volatility. Conversely, if volume profile is relatively dispersed, it indicates that investors' purchase prices differ significantly, and they may respond in different ways, which may result in greater stock price volatility.
In the following section, we will introduce how to develop investment strategies using a volume profile chart.
To develop investment strategies using a volume profile chart, we first need to focus on volume concentration. This mainly concerns the distribution of stock ownership. If major shareholders or institutions hold a large number of shares, the stock's price is more likely to be influenced by them. Conversely, if stock ownership is relatively dispersed, the stock price can more accurately reflect the market's true assessment of the company.
Second, we should study the cost of the positions. This mainly involves examining the purchase prices of most shareholders. If their purchase prices are low, they may choose to sell when the stock price rises, which could cause the stock price to decline. However, if their purchase prices are high, they may choose to buy when the stock price falls, which can help support the stock price.
Finally, we need to consider the stability of the positions. This mainly depends on shareholders' holding periods. If most shareholders have relatively long holding periods, the stock's price will be relatively stable. If most shareholders have relatively short holding periods, the stock's price may experience greater volatility.
By gaining an in-depth understanding of volume profile, investors can better understand a stock's market conditions and make more rational investment decisions. To better understand how volume profile affects investment decisions, let us examine two scenarios below: Suppose a company's stock is publicly traded in the market. The company is an emerging technology company with high growth potential. The current stock price is 100 dollars per share, and its market capitalization is 1 billion dollars.
Scenario One: Most Positions Are Held by Long-Term Investors In this situation, most of the shares are held by long-term investors who are optimistic about the company's prospects. These investors believe the company's value will continue to grow, and they are unlikely to sell their shares in the short term. This means that fewer shares are available for trading in the market, and the market supply is relatively scarce. If some positive news is announced or outside investors express interest in the company, this could prompt other investors to follow suit, causing the stock price to rise significantly. Therefore, understanding volume profile is crucial to an investment decision for a potential investor. They may decide to purchase the stock because the volume profile suggests that there is room for an upward move and that a supply shortage may occur.
Scenario Two: Volume Profile Is Highly Concentrated Among a Small Number of Speculative Traders Suppose that, in this situation, volume profile is highly concentrated among a small number of speculative traders who are more inclined to engage in short-term buying and selling for quick profits. They focus on the stock's short-term price fluctuations rather than the company's fundamentals. If these speculative traders begin selling large amounts of stock, an oversupply will emerge in the market, and the stock price may fall rapidly. In this situation, potential investors may be deterred by the risks indicated by the volume profile and choose not to invest or wait for the stock price to fall before entering the market. These two cases demonstrate the impact of volume profile on investment decisions. Investors can assess market sentiment, supply and demand, and potential risks by observing volume profile.
3. Methods for Analyzing Volume Profile
Obtaining and analyzing volume profile data can help investors understand the sentiment and behavior of market participants and make more informed investment decisions. The following are some common methods for analyzing volume profile:
Market Order Book: One way to obtain volume profile data is through the market order book. The market order book shows the quantities and price levels of buy and sell orders. By observing the order book, you can analyze the quantities of buy and sell orders at different price levels and thereby infer the position distribution. For example, if there are more sell orders at higher price levels and more buy orders at lower price levels, this may indicate that the volume profile is tilted toward sellers.
Volume analysis: Volume is another important indicator used to analyze volume profile. By observing volume, you can understand the amount of buying and selling at specific price levels. Larger volume typically indicates greater shift in traded volume across price levels. For example, a rise accompanied by heavy volume may suggest that ownership is shifting from weaker holders to stronger holders.
Technical indicators: Some technical indicators can also be used to analyze volume profile. For example, indicators such as the Relative Strength Index (RSI) and moving averages (MA) can provide information about market participant sentiment and volume profile. These indicators can show overbought and oversold conditions, thereby helping investors determine volume profile.
Data providers and analytical tools: Many financial data providers and analytical tools offer volume profile data and analytical functions. These platforms can provide volume profile charts, data reports, and indicators for stocks, options, or other securities. You can use these tools to observe information such as the proportions of market participants, their holdings, and trading patterns. Regardless of the method used, understanding volume profile requires considering multiple factors comprehensively and combining it with other market indicators and fundamental analysis. This provides a more comprehensive view of the market and helps you make more informed investment decisions.
4. Practical Strategies
Practical strategies based on volume profile provide investors with a basis for decision-making under different market conditions. By comprehensively analyzing volume profile, volume, support/resistance levels, and the Relative Strength Index (RSI), investors can develop more comprehensive and reliable investment strategies.
Combining volume profile with trend confirmation can provide investors with important information about market trends. When many positions are concentrated at a specific price level in the market, accompanied by a rise or fall in price, this indicates that the trend may continue. Investors can use this information to confirm the trend and adopt corresponding buying or selling strategies.
Combining trading volume with volume profile can further improve the accuracy of investment decisions. In an uptrend, if trading volume increases and positions are concentrated at high price levels, this means that buying power is strengthening, and investors may consider continuing to hold or buying the asset. Conversely, in a downtrend, if trading volume increases and positions are concentrated at low price levels, this may mean that selling power is strengthening, and investors may consider reducing their holdings or selling the asset.
Using volume profile together with support/resistance levels can help identify key price levels in the market. When many positions are concentrated at a specific price level, this may form support or resistance. Investors can use these price levels to determine when to buy or sell. If the price breaks through a resistance level, accompanied by a significant shift in volume profile, this may be a buy signal. Conversely, if the price falls below a support level, accompanied by a large concentration of positions at low price levels, this may be a sell signal. In addition, combining volume profile with the Relative Strength Index (RSI) can provide a more comprehensive market analysis. When volume profile shows that most investors favor buying and the RSI indicates that the asset is oversold, this may signal a potential buying opportunity. Conversely, when volume profile shows that most investors favor selling and the RSI indicates that the asset is overbought, this may be a sell signal.
Practical strategies for volume profile play an important role in investment decisions. By comprehensively analyzing volume profile, trading volume, support/resistance levels, and the RSI, investors can better understand market conditions and develop corresponding investment strategies. However, it is important to note that volume profile analysis is not absolutely accurate, and market risks and other factors must also be considered comprehensively. Investors should make decisions based on their own risk tolerance, investment objectives, and the results of market research. In actual trading, it is also recommended to use risk-control measures, such as stop-loss orders and asset diversification, to protect their funds.
5. Limitations
Although volume profile is a useful tool, it also has some limitations and misconceptions. Investors should note the following points when using volume profile analysis:
Lack of underlying reasons: Volume profile can only provide an overall view of asset holders, but it cannot offer in-depth insight into each holder's motivations and reasons for making decisions. Therefore, relying solely on volume profile to make investment decisions may overlook important information and factors.
Information lag: Volume profile is calculated based on historical trading data, so it reflects past conditions. The volume profile of market participants may change over time, so relying solely on volume profile to predict future market trends involves a certain degree of uncertainty.
Lack of company fundamental analysis: Volume profile focuses only on the holdings of market participants while overlooking the company's fundamental factors, such as its financial condition, performance, and management team. These factors are equally important to the stock price, and investors need to consider both the company's fundamentals and volume profile comprehensively to make more informed investment decisions.
Market manipulation and trading strategies: Volume profile may be affected by market manipulation and specific trading strategies. Some market participants may intentionally manipulate volume profile to influence market sentiment and price trends, which may lead to distortion or misleading signals in volume profile. Therefore, investors need to carefully assess the motivations behind volume profile and any potential manipulation. In summary, volume profile analysis is a useful supplementary tool, but it cannot replace comprehensive company analysis and research.
Summary
In investment decision-making, volume profile is an important tool that can help investors understand the holdings and sentiment of market participants and provide a basis for investment decisions. By comprehensively analyzing volume profile, trading volume, support/resistance levels, and the relative strength index (RSI), investors can better understand the market and develop corresponding investment strategies.
However, volume profile analysis also has its limitations, including a lack of underlying reasons, information lag, a lack of company fundamental analysis, and the impact of market manipulation. Therefore, volume profile should only be used as a supplementary tool for investment decisions, rather than the sole basis. Investors should comprehensively consider the company's fundamentals, market trends, and other technical indicators to fully assess investment opportunities and risks.
Most importantly, continuous learning and practice are key to improving volume profile analysis skills and effectiveness. Investors should continuously conduct in-depth research and gain an understanding of the methods and techniques of volume profile analysis, improving their analytical abilities through practice and the accumulation of experience. At the same time, communicating and sharing experiences with other investors and professionals can also help investors broaden their horizons and deepen their understanding of the market.
Overall, volume profile analysis plays an important role in investment decision-making and can provide investors with information about market participants' holdings and sentiment. However, investors need to recognize its limitations and combine volume profile with company fundamental analysis and other tools to make comprehensive and accurate investment decisions. Continuous learning and practice are key to continually improving volume profile analysis skills and effectiveness. By continuously improving their abilities, investors can better use volume profile analysis to guide their investment actions.