

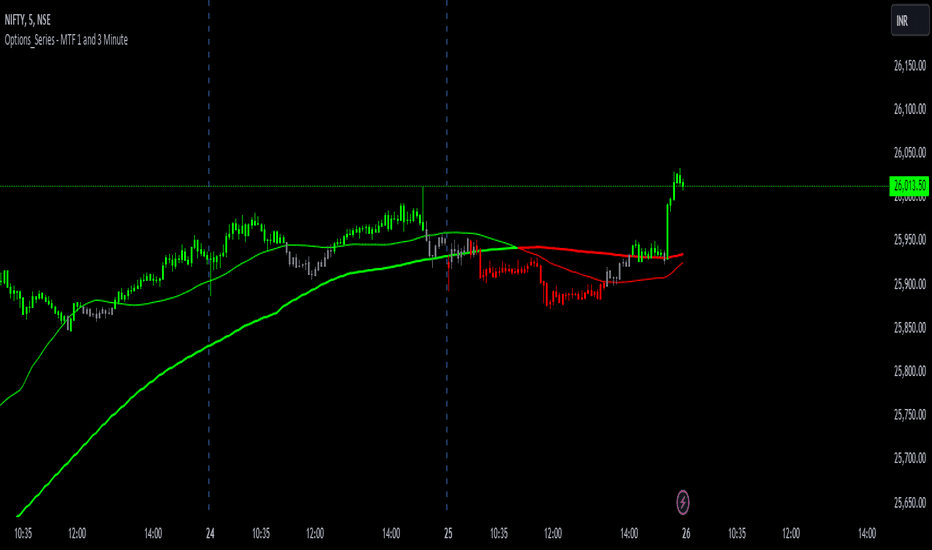
Dual Moving Average Strategy
Learn how the dual moving average strategy works, detect crossover signals with Python, and backtest trading rules using historical market data, realistic trading costs, and risk controls.
For quantitative traders, a moving average crossover can provide a systematic way to identify potential trend changes. However, comparing two moving averages at a single point is not enough to determine whether a new trading signal has occurred. A strategy must detect the actual crossover, use consistent price data, and account for execution costs when backtesting.
The dual moving average strategy uses a short-term moving average and a long-term moving average to identify potential entry and exit points. This guide explains the signal logic, provides a runnable Python example, and outlines how to test the strategy before deploying it in a live trading system.
How the Dual Moving Average Strategy Works
A dual moving average strategy calculates two averages from the same price series but uses different lookback periods.
Short-term moving average (fast MA) responds more quickly to recent price movements. A 5-period moving average, for example, uses the latest five completed candles.
Long-term moving average (slow MA) changes more gradually because it covers a longer period, such as 20 candles. It provides a reference for the broader price trend.
For a simple moving average (SMA), the calculation is:
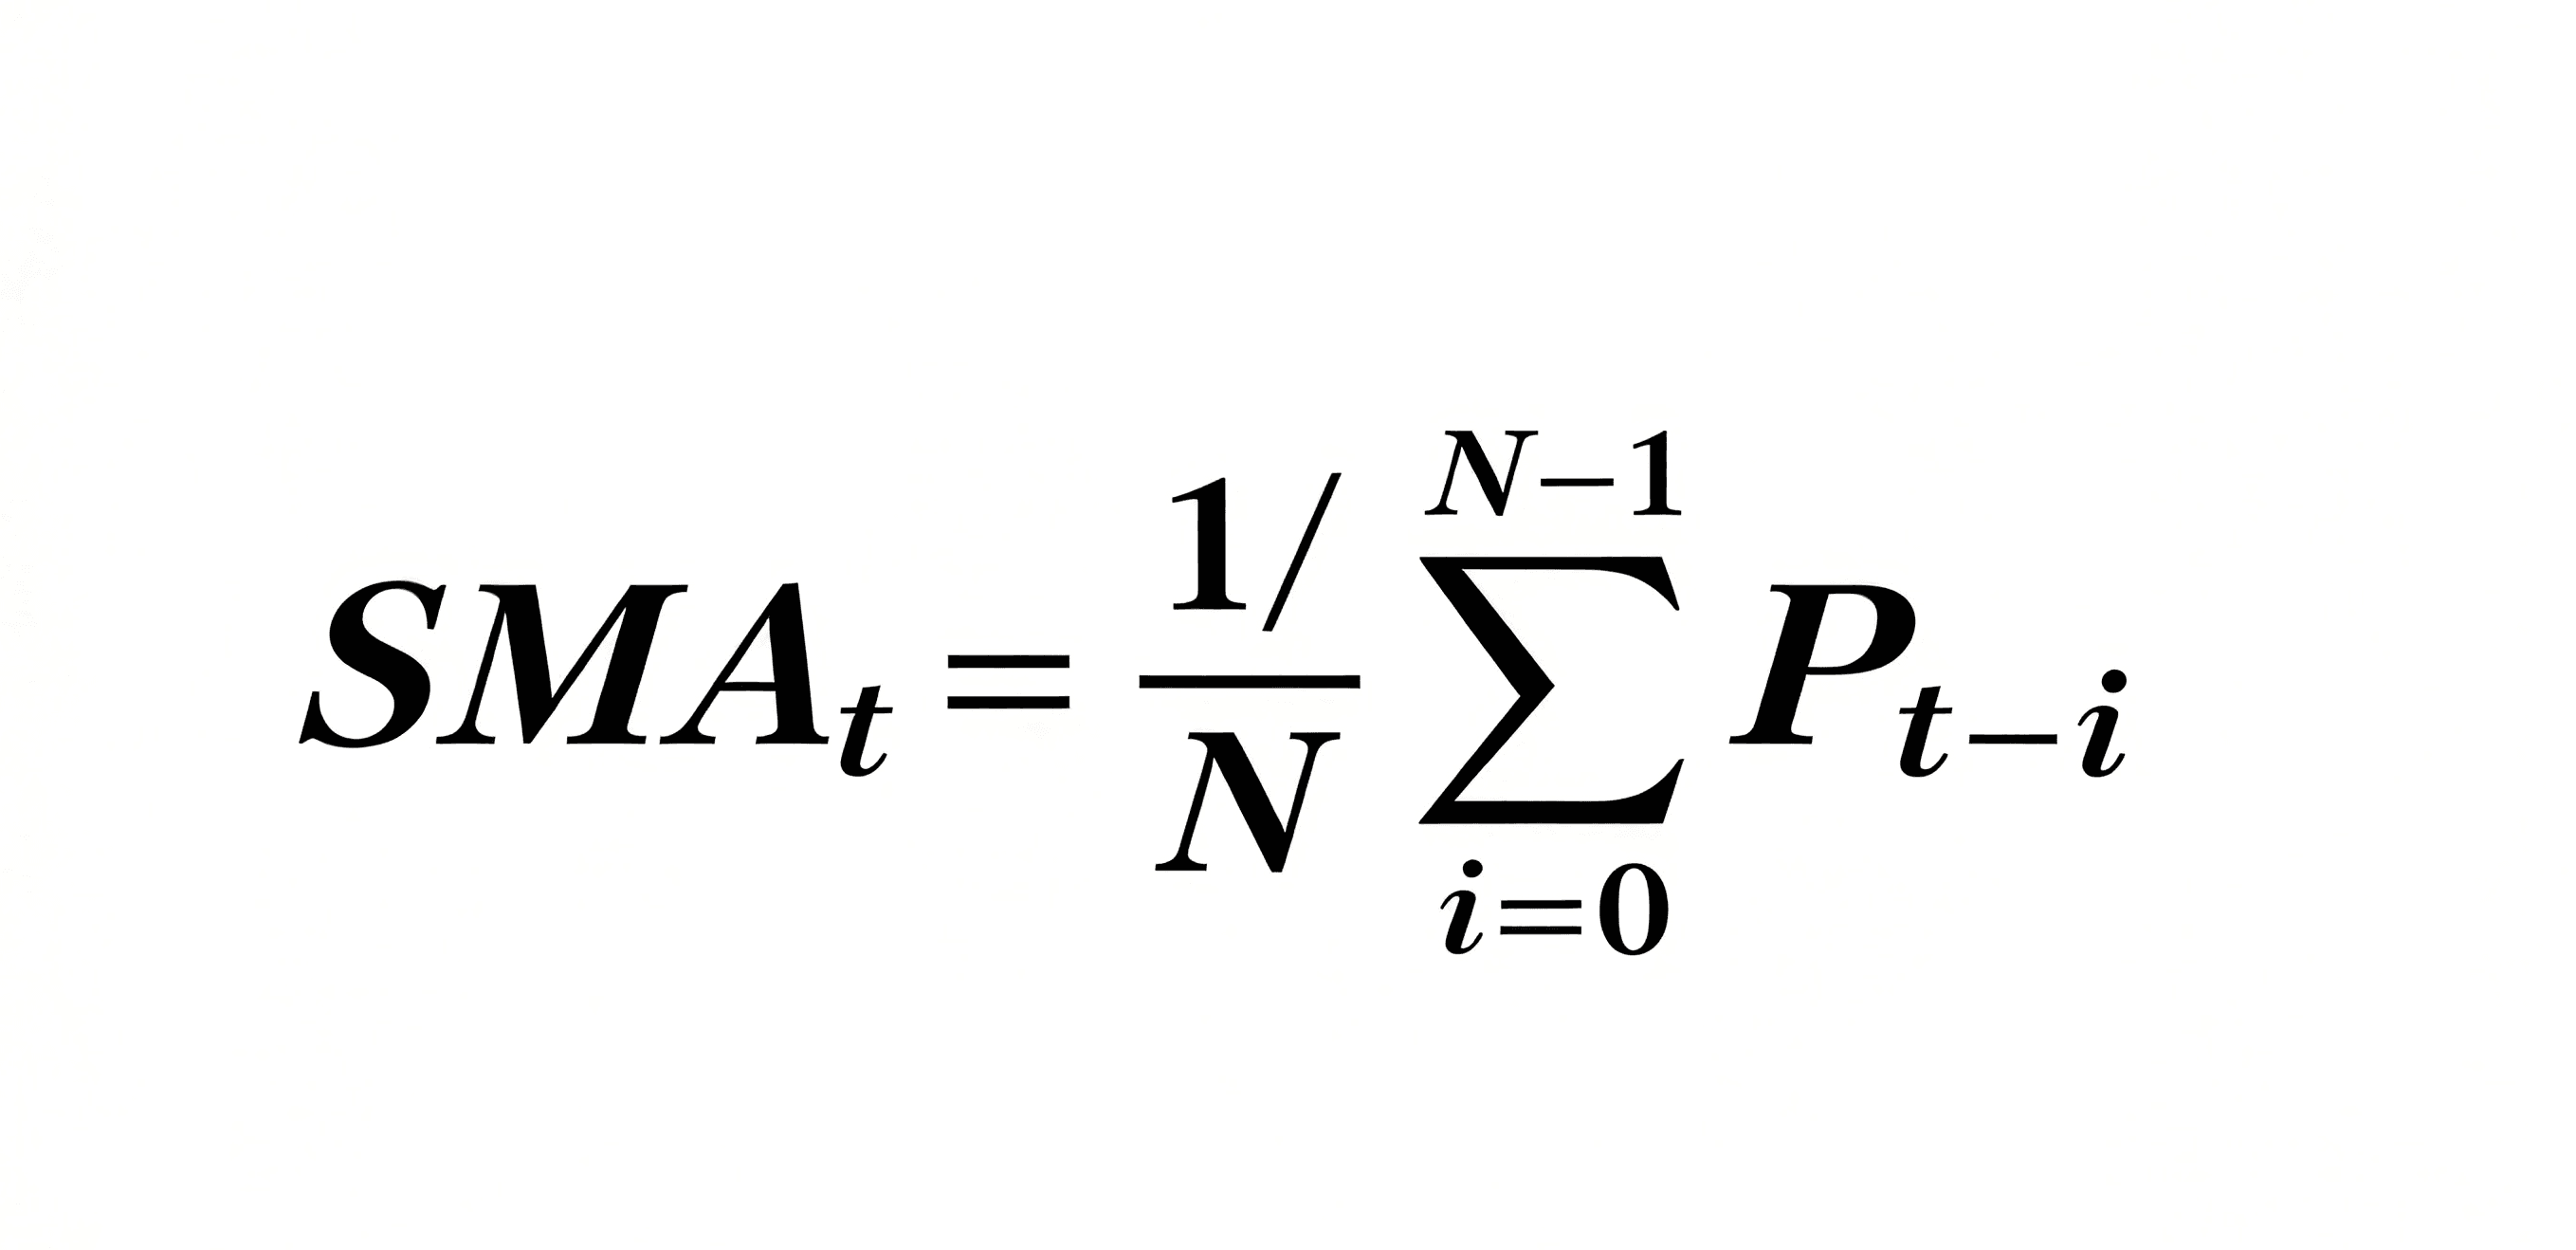
Here, \(P\) represents the closing price of a candle, \(N\) is the lookback period, and \(t\) is the current completed candle.
The strategy compares the two averages over consecutive candles to determine whether a crossover has occurred.
| Signal | Crossover condition | Typical interpretation |
|---|---|---|
| Bullish crossover | Fast MA moves from at or below the slow MA to above it | Potential long-entry signal |
| Bearish crossover | Fast MA moves from at or above the slow MA to below it | Potential exit or short-entry signal |
| No crossover | Neither crossover condition is met | No new crossover signal |
A bullish crossover is often called a golden cross, while a bearish crossover is called a death cross. These terms are also commonly associated with specific longer-term moving average pairs.
The key distinction is that the fast MA being above the slow MA describes the current relationship; a crossover identifies a change in that relationship. A strategy that checks only the current relationship may repeatedly generate the same signal instead of detecting a new event.
Implementing the Strategy in Python
The following example detects crossover events using historical closing prices. It uses synthetic data for demonstration, so the results do not represent actual market performance.
def sma(prices, period):
    if len(prices) < period:
        return None
    return sum(prices[-period:]) / period


def generate_signals(prices, short_period=5, long_period=20):
    if not 0 < short_period < long_period:
        raise ValueError(
            "Periods must satisfy 0 < short_period < long_period"
        )

    signals = []

    for i in range(long_period, len(prices)):
        previous = prices[:i]
        current = prices[:i + 1]

        prev_fast = sma(previous, short_period)
        prev_slow = sma(previous, long_period)
        curr_fast = sma(current, short_period)
        curr_slow = sma(current, long_period)

        if prev_fast <= prev_slow and curr_fast > curr_slow:
            signals.append((i, "BUY"))

        elif prev_fast >= prev_slow and curr_fast < curr_slow:
            signals.append((i, "SELL"))

    return signals


# Synthetic prices: falling trend, rising trend, then falling trend
prices = (
    [100 - 0.5 * i for i in range(25)]
    + [87.5 + 0.8 * i for i in range(35)]
    + [114.7 - 0.9 * i for i in range(35)]
)

signals = generate_signals(prices, short_period=5, long_period=20)

for bar_index, signal in signals:
    print(f"Bar {bar_index}: {signal}")
The function evaluates the previous and current moving average relationships. It records a signal only when the relationship changes, rather than every time one average remains above or below the other.
The 5-period and 20-period settings are illustrative. For a live strategy, the appropriate periods depend on the instrument, candle interval, holding period, and trading costs.
The BUY and SELL labels represent signals, not executed orders. In a long-only strategy, a bearish crossover might close an existing position. In a long-short strategy, it could trigger a short entry, subject to additional rules.
Backtesting Before Live Deployment
A crossover rule that looks reasonable on a chart may perform poorly once execution costs and market conditions are considered. Quantitative traders should evaluate the complete strategy using historical data before connecting it to live execution.
Start by selecting a consistent candle interval and a historical period that covers different market conditions. Calculate both moving averages using only prices available at each decision point, and generate signals after the relevant candle has closed.
During testing, pay particular attention to:
- Trading costs: Include fees, bid-ask spreads, slippage, and realistic execution assumptions.
- False signals: Measure how often crossovers occur in sideways markets and whether frequent trading erodes returns.
- Look-ahead bias: Do not use a candle's final closing price to generate a signal before that price was available.
- Out-of-sample performance: Test the chosen parameters on data not used to optimize them.
- Risk management: Define position sizing, maximum exposure, and exit rules instead of relying on crossover signals alone.
Compare net returns with maximum drawdown, turnover, win rate, and risk-adjusted performance. A parameter combination that maximizes historical profit may simply fit past price movements and fail in a different market environment.
Working With Historical and Real-Time Market Data
Data consistency is essential when moving from a backtest to a live quantitative strategy. Historical candles and live updates must use compatible symbol definitions, timestamps, price fields, and intervals. Otherwise, a strategy may produce different signals in testing and production.
AllTick provides historical market data through REST API requests and real-time quotes and tick data through WebSocket streaming for supported instruments. Quantitative traders can use historical candles to calculate moving averages and evaluate crossover rules, then use real-time updates to maintain their live market-data pipeline.
The AllTick API documentation describes the available REST endpoints and data access methods. Before implementation, verify the required instrument, candle interval, historical coverage, and subscription permissions.
For a live system, avoid recalculating a completed candle as though it were still forming. If the strategy is designed to act on candle closes, evaluate the crossover only after the candle is complete, then apply the execution rules defined in the backtest.
Limitations of the Dual Moving Average Strategy
The dual moving average strategy is easy to implement, but it is a lagging, trend-following method. Both averages are calculated from historical prices, so a signal may appear after a trend has already begun.
Its performance can also deteriorate in range-bound markets, where repeated crossovers generate false entries and exits. Adding an RSI filter, a volatility condition, or a broader trend filter may help reduce some unwanted trades, but each additional rule should be tested rather than assumed to improve results.
Ultimately, the dual moving average strategy is best treated as a transparent baseline for quantitative research. Its value comes from defining repeatable signals, testing them against historical market data, and evaluating whether their performance remains robust after realistic costs and risk controls.