

Quantitative Practice: In-Depth Explanation of the RSI Indicator
Learn how quantitative traders calculate RSI in Python, define objective trading signals, select indicator parameters, and backtest strategies using historical market data.
The Relative Strength Index (RSI) is a momentum oscillator developed by J. Welles Wilder and introduced in 1978. For quantitative traders, the RSI indicator offers a systematic way to measure price momentum, define trading conditions, and evaluate potential entry and exit signals.
However, an RSI reading above 70 does not guarantee a price decline, and a reading below 30 does not guarantee a rebound. A reliable RSI trading strategy requires consistent market data, explicit signal rules, and backtesting that accounts for transaction costs and execution timing.
This guide explains how RSI works, how to calculate it in Python, and how to incorporate it into a reproducible quantitative research workflow.
How the RSI Indicator Works
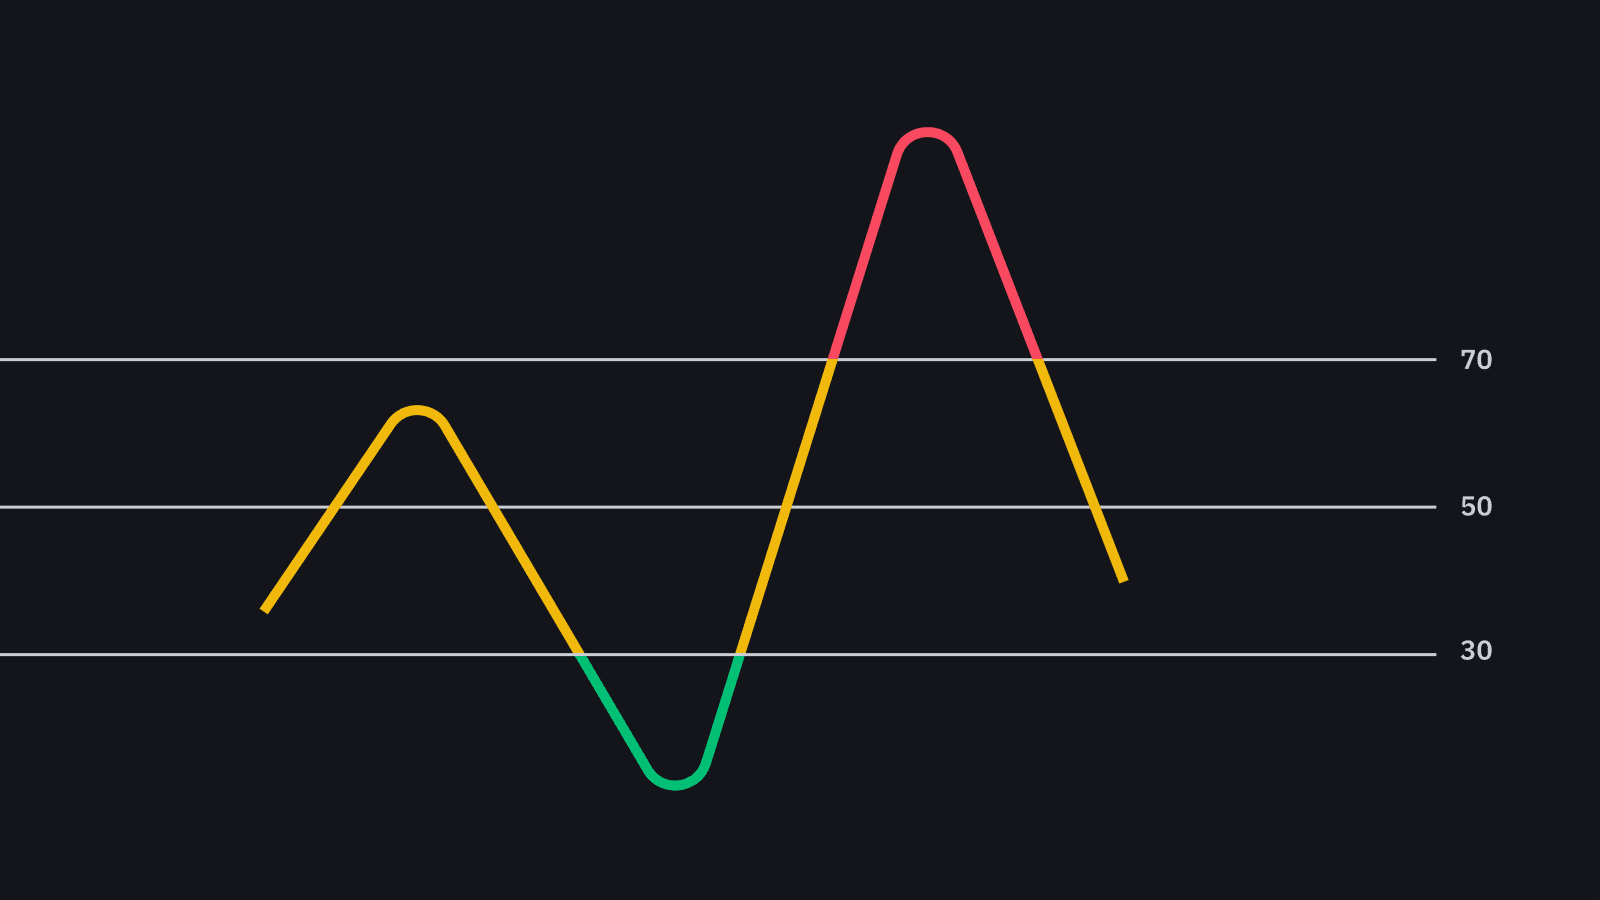
RSI compares recent average gains with recent average losses and expresses the result on a scale from 0 to 100. Its standard lookback period is 14 bars, although traders can adjust the period and bar interval to suit their strategies.
| RSI level | Common interpretation | Quantitative consideration |
|---|---|---|
| Above 70 | Potentially overbought | Evaluate momentum weakening or reversal conditions |
| Below 30 | Potentially oversold | Look for recovery signals or additional confirmation |
| Between 30 and 70 | Neither threshold reached | Evaluate the broader trend and other conditions |
These thresholds are reference points rather than automatic buy or sell instructions. RSI can remain above 70 during a strong uptrend or below 30 during a sustained downtrend.
For quantitative traders, the key is to translate indicator readings into explicit, testable rules instead of relying on subjective chart interpretation.
How to Calculate RSI
RSI starts with the difference between consecutive closing prices. Positive changes become gains, while negative changes become losses.
Relative strength (RS) is calculated as:
[
RS=\frac{\text{Average Gain}}{\text{Average Loss}}
]
The RSI formula is:
[
RSI=100-\frac{100}{1+RS}
]
Wilder's original RSI uses smoothed average gains and losses. For a 14-period RSI, after calculating the initial averages, subsequent values are updated as follows:
[
AG_t=\frac{13AG_{t-1}+G_t}{14}
][
AL_t=\frac{13AL_{t-1}+L_t}{14}
]Here, (G_t) represents the current gain, (L_t) represents the current absolute loss, and (AG_t) and (AL_t) are the smoothed averages.
For example, if average gain is 8.57 and average loss is 2.86, RS is approximately 3 and RSI is approximately 75. This indicates strong recent upward momentum, but does not establish that a reversal will occur.
When comparing RSI calculations across platforms, use consistent input prices, lookback periods, and initialization methods. The treatment of missing data and the initial smoothing period can affect early readings.
Choosing RSI Parameters for Quantitative Trading
The best RSI period depends on the strategy's timeframe, instrument, and trading frequency.
| RSI period | Typical behavior | Trade-off |
|---|---|---|
| 7 | Responds quickly to price changes | More sensitive to noise |
| 14 | Common baseline for testing | May not fit every market |
| 21 | Produces smoother readings | Can react more slowly |
A 14-period RSI calculated from one-minute candles is different from one calculated from daily candles. The period alone does not define a strategy; the bar interval matters just as much.
Instead of assuming that a particular period works best for stocks, forex, commodities, or cryptocurrencies, compare several settings on historical data. Use out-of-sample testing to check whether the results remain consistent beyond the period used to select parameters.
Implementing an RSI Strategy in Python
The following example calculates RSI from historical closing prices and identifies threshold-crossing events. It uses a CSV file to keep indicator calculations separate from market-data retrieval.
Install the required packages:
pip install pandas taPrepare prices.csv with a close column containing historical closing prices in chronological order.
    if not 0 <= oversold < overbought <= 100:
        raise ValueError("Invalid RSI thresholds")

    df = data.copy()

    if "close" not in df.columns:
        raise ValueError("Missing close column")

    df["close"] = pd.to_numeric(
        df["close"], errors="raise"
    )

    if df["close"].isna().any():
        raise ValueError("Missing closing prices")

    if not df["close"].map(
        lambda value: pd.notna(value) and value > 0
    ).all():
        raise ValueError("Prices must be positive")

    df["RSI"] = RSIIndicator(
        close=df["close"],
        window=period
    ).rsi()

    previous = df["RSI"].shift(1)
    current = df["RSI"]

    df["Signal"] = 0

    # RSI crosses back above the oversold threshold
    df.loc[
        (previous <= oversold) &
        (current > oversold), "Signal"
    ] = 1

    # RSI crosses back below the overbought threshold
    df.loc[
        (previous >= overbought) &
        (current < overbought), "Signal"
    ] = -1

    return df


if __name__ == "__main__":
    prices = pd.read_csv("prices.csv")
    result = rsi_strategy(prices)

    print(result[["close", "RSI", "Signal"]].tail())
A signal of 1 marks an upward crossing of the oversold threshold, while -1 marks a downward crossing of the overbought threshold. A value of 0 means neither event occurred on that bar.
This example calculates indicator events; it does not execute orders or establish a profitable trading system. Before use, ensure that the input is correctly ordered, contains sufficient historical observations, and represents the intended bar interval. The ta library's RSI initialization may also differ from a custom implementation of Wilder's smoothing.
Using Market Data to Calculate RSI
RSI depends on a consistent sequence of closing prices. Missing candles, duplicated timestamps, incorrect ordering, or mixing different intervals can distort the indicator and create misleading signals.
A quantitative workflow should therefore:
- Retrieve historical candles for the instrument and interval being tested.
- Sort records by timestamp and check for missing or duplicated bars.
- Calculate signals from completed candles unless the strategy explicitly uses intrabar updates.
- Keep historical testing separate from live signal generation.
- Record the data source, indicator parameters, and signal timestamp for reproducibility.
AllTick's REST API documentation provides the current reference for its market-data interfaces. The REST API includes single-instrument historical K-line queries and latest-market-data endpoints. Check the documentation for the appropriate instrument, endpoint, authentication requirements, and request limits before integrating data into a strategy.
For RSI research, historical candles are the starting point for calculating indicator values and evaluating past signals. Latest quotes or tick updates serve a different purpose and should not be treated as interchangeable with completed historical bars.
Backtesting RSI Strategies Before Deployment
A threshold-crossing signal is only one component of a trading strategy. Before considering live deployment, define the position-entry rules, exit conditions, position sizing, and risk limits.
A meaningful backtest should account for:
- Execution timing: Do not assume a signal calculated from a candle's closing price could be filled at that same close without a realistic execution model.
- Trading costs: Include commissions, spread, and slippage where applicable.
- Out-of-sample performance: Test selected parameters on data that was not used to optimize them.
- Market conditions: Compare results across different volatility and trend regimes.
- Robustness: Check whether modest changes to the RSI period or thresholds materially change performance.
Evaluate net returns alongside drawdown, trade frequency, and risk-adjusted performance. Avoid selecting a strategy solely because one parameter combination produces attractive historical results.
Build a Reproducible RSI Research Workflow
RSI is most useful to quantitative traders when it forms part of a repeatable process: obtain consistent historical data, calculate the indicator, define objective signal rules, and test the strategy under realistic assumptions.
Start with the standard 14-period RSI as a baseline, compare alternatives using historical data, and validate the results before considering live deployment. AllTick's market-data documentation can help you identify the relevant data interfaces for building this workflow.