


The Turtle Trading Strategy: A Classic Trend-Following System
Learn how the Turtle Trading Strategy uses price breakouts, volatility-based position sizing, stop losses, and trailing exits. Explore Python signal generation and reliable market data practices for quantitative backtesting.
The Turtle Trading Strategy is a systematic trend-following approach developed by Richard Dennis and William Eckhardt in the 1980s. For quantitative traders, its value lies in turning market movements into explicit trading rules that can be tested against historical data.
The strategy combines price breakouts, volatility-based position sizing, predefined stop losses, and trailing exits. However, implementing it correctly requires more than identifying a new high or low. Traders must also account for execution timing, transaction costs, and portfolio exposure.
How the Turtle Trading Strategy Works
The original Turtle experiment explored whether traders could learn a systematic approach instead of relying on intuition. Its rules defined when to enter, how much to trade, where to place stops, and when to exit. The published Original Turtle Rules provide a reference for reproducing the system.
The strategy contains two main trading systems:
| Rule | System 1 | System 2 |
|---|---|---|
| Entry | 20-day breakout | 55-day breakout |
| Entry filter | Skip certain breakouts after a winning previous breakout | No filter |
| Exit | Opposite 10-day breakout | Opposite 20-day breakout |
| Initial stop | 2N from entry | 2N from entry |
rage true range. System 1 also uses a 55-day breakout as a fallback when its entry filter blocks a signal.
These rules were originally designed for futures markets. Applying them to stocks, forex, or other instruments requires appropriate trading-session definitions, contract specifications, and execution assumptions.
Entry Signals and Exit Rules
A breakout occurs when price moves beyond the highest high or lowest low of a defined lookback period.
For System 1, a long entry is triggered when price breaks above the previous 20-day high; a short entry follows a break below the previous 20-day low. System 2 applies the same logic to a 55-day channel.
System 1 includes an additional filter: a new 20-day breakout is skipped when the previous breakout in that market would have produced a winning trade under the system's rules. A 55-day breakout remains available as a fallback.
Exits use shorter lookback periods. System 1 closes a long position after a break below the 10-day low, while System 2 uses the 20-day low. Short positions exit when price breaks above the corresponding channel high.
Unlike strategies with fixed profit targets, the Turtle system allows profitable trades to continue while the trend remains intact. This also means that many breakout attempts can fail before a sustained trend develops.
Position Sizing and Risk Management
The Turtle Trading Strategy adjusts position size according to volatility. More volatile instruments receive smaller positions, helping make risk more consistent across markets.
A simplified position-sizing formula is:
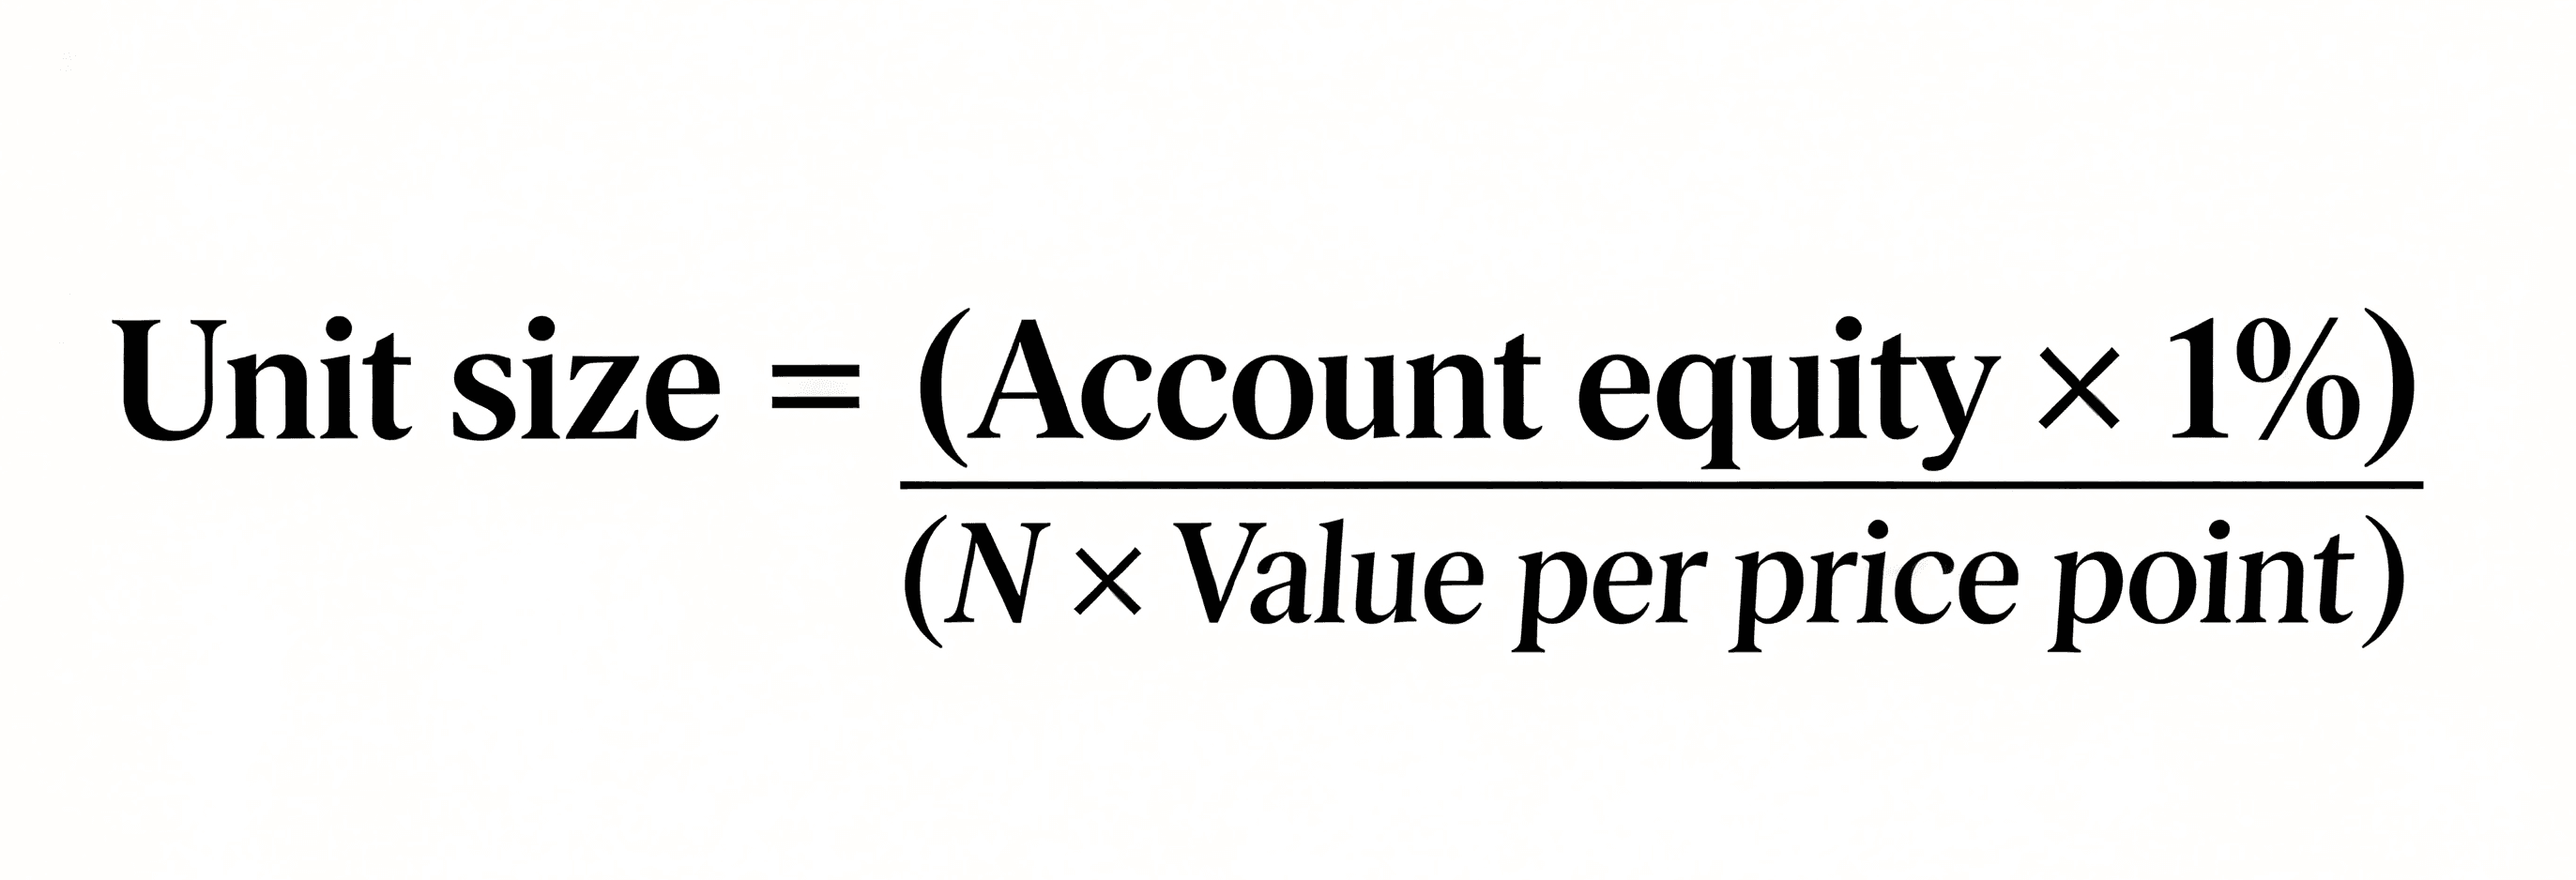
For example, assume an account has $100,000 in equity, N equals $2 per share, and the instrument is a stock. One unit would be:

An initial stop placed 2N below the entry price would be $4 per share away. For 500 shares, the theoretical loss at that stop would be $2,000, excluding transaction costs and slippage.
This example illustrates an important distinction: the sizing formula defines the intended risk, but actual losses can exceed the estimate when prices gap through stop levels.
The original system also permitted adding units as the market moved favorably, typically at intervals of 0.5N, up to four units under the standard rules. Pyramiding increases exposure, so a backtest should account for both individual position risk and overall portfolio limits.
Python Example for Turtle Trading Signals
The following Python code calculates the volatility measure, breakout channels, and entry and exit signals. It implements a simplified, close-confirmed 20-day entry and 10-day exit variant, rather than the entire original system.
The input must be a pandas DataFrame containing daily Open, High, Low, and Close columns.
import numpy as np
import pandas as pd


def turtle_signals(
    ohlc,
    entry_period=20,
    exit_period=10,
    n_period=20
):
    required = {"Open", "High", "Low", "Close"}

    if not required.issubset(ohlc.columns):
        raise ValueError(
            "Data must contain Open, High, Low, and Close."
        )

    if min(entry_period, exit_period, n_period) < 1:
        raise ValueError("Lookback periods must be positive.")

    df = ohlc.copy().sort_index()
    df[list(required)] = df[list(required)].astype(float)

    if df.empty or df[list(required)].isna().any().any():
        raise ValueError("OHLC data must be non-empty and complete.")

    previous_close = df["Close"].shift(1)

    true_range = pd.concat(
        [
            df["High"] - df["Low"],
            (df["High"] - previous_close).abs(),
            (df["Low"] - previous_close).abs(),
        ],
        axis=1,
    ).max(axis=1)

    # Initialize N with a simple average, then smooth it.
    df["N"] = np.nan
    if len(df) >= n_period:
        df.iloc[n_period - 1, df.columns.get_loc("N")] = (
            true_range.iloc[:n_period].mean()
        )

        n_col = df.columns.get_loc("N")
        for i in range(n_period, len(df)):
            df.iloc[i, n_col] = (
                (n_period - 1) * df.iloc[i - 1, n_col]
                + true_range.iloc[i]
            ) / n_period

    # Exclude the current bar from all breakout channels.
    df["entry_high"] = (
        df["High"].rolling(entry_period).max().shift(1)
    )
    df["entry_low"] = (
        df["Low"].rolling(entry_period).min().shift(1)
    )
    df["exit_high"] = (
        df["High"].rolling(exit_period).max().shift(1)
    )
    df["exit_low"] = (
        df["Low"].rolling(exit_period).min().shift(1)
    )

    ready = df["N"].notna()
    df["entry_signal"] = 0

    df.loc[
        ready & (df["Close"] > df["entry_high"]),
        "entry_signal"
    ] = 1

    df.loc[
        ready & (df["Close"] < df["entry_low"]),
        "entry_signal"
    ] = -1

    df["exit_long"] = (
        ready & (df["Close"] < df["exit_low"])
    )
    df["exit_short"] = (
        ready & (df["Close"] > df["exit_high"])
    )

    return df
Call turtle_signals(ohlc) for the 20/10 variant. For the 55/20 variant, use turtle_signals(ohlc, entry_period=55, exit_period=20).
The output provides reusable signals, not a complete trading engine. Before evaluating performance, implement order execution, 2N stops, position sizing, transaction costs, and any System 1 filters or pyramiding rules required by the chosen system. A close-confirmed signal should generally be executed on a subsequent bar in this simplified model; it should not automatically be filled at the same close that generated it.
Backtesting with Reliable Market Data
Historical data quality directly affects breakout calculations. Missing candles, inconsistent timestamps, incorrect session boundaries, and unsuitable price adjustments can all change entry and exit signals.
A useful backtesting workflow should include three checks:
- Data validation: Check candle continuity, timestamps, price fields, and instrument coverage before calculating indicators.
- Execution simulation: Apply realistic entry timing, stop fills, spreads, commissions, slippage, and gap handling.
- Performance evaluation: Measure net returns, maximum drawdown, trade frequency, and risk-adjusted performance across different periods and instruments. Validate the selected rules on data not used for parameter selection.
For historical candle preparation, AllTick API documentation is a relevant starting point for reviewing its market-data interfaces. Before retrieving data, verify the instrument, interval, historical depth, and applicable account limits. AllTick's historical K-line service notice specifies a maximum of 500 historical K-line records per single-product request, so longer datasets may require multiple requests.
The Turtle Trading Strategy remains a useful framework for systematic trend following, but it does not guarantee profitability. For quantitative traders, the priority is to reproduce the intended rules, verify historical data, model execution realistically, and test risk-adjusted performance before considering live deployment.